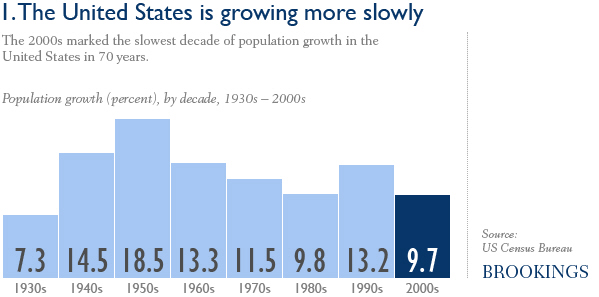
The 2000s marked the slowest decade of population growth in the United States in 70 years, slightly under the rate from the 1980s. The country grew by 9.7 percent, adding 27.3 million people from 2000 to 2010. The pullback from rapid 13.2 percent growth in the 1990s reflects slower U.S. economic growth across the decade, reduced immigration, and the aging of baby boomers out of their prime child-bearing years.
As in previous decades, the Sun Belt accounted for most of the nation’s population growth in the 2000s. Southern and Western states added 23 million people, compared to just 4 million added in the Northeast and Midwest. Las Vegas and Raleigh were the fastest-growing large metro areas (42 percent), while greater Detroit and Youngstown lost residents. And suburbs continued to grow faster than cities. However, many of these patterns began to shift in the late 2000s amid a housing market crash that hit fast-growing Sun Belt and outer suburban locations especially hard.
What it means
Despite the recent decade’s slowdown, America remains one of the fastest-growing developed nations. We added the equivalent of more than three-quarters of Canada’s population in just 10 years, helping to replenish our workforce and offset the costs of an aging society. Population growth will continue to vary greatly across the national and metropolitan maps, but ongoing restructuring in the U.S. economy and housing market may reduce somewhat the imbalances from the 2000s in the years to come.
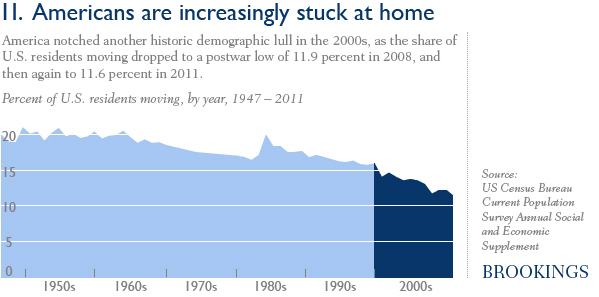
America recorded another historic demographic lull in the 2000s, as the share of U.S. residents moving dropped to a postwar low of 11.9 percent in 2008, and then again to 11.6 percent in 2011. During the baby boom of the 1950s, by contrast, nearly one-fifth of Americans changed residences each year. The long-term trends toward higher homeownership and the aging of the baby boomers and the short-term dynamics of deep recession, depressed housing prices, and stringent credit policies produced a record level of rootedness among American households.
The migration slowdown reversed in part the tide that swept many Americans into Sun Belt areas like Las Vegas and Orlando during the first half of the decade. One upshot is that population losses from many former “feeder” areas, such as New York, Los Angeles, and Boston have slowed considerably, especially among migrants with college degrees. Meanwhile, Austin, Dallas, and Denver displaced Riverside, Phoenix, and Atlanta from the list of metro areas gaining the most young migrants at the end of the decade.
What it means
Americans move around more than their counterparts in other developed countries, but a lot less than they used to. Some fear that in the short run, homeowners are stuck in places with too few jobs, and not able or willing to move to places with healthier labor markets. Longer run, and perhaps more importantly, states and metro areas that relied too heavily on in-migration for growth must re-calibrate their economies to create better, more diverse job opportunities for current and future residents.
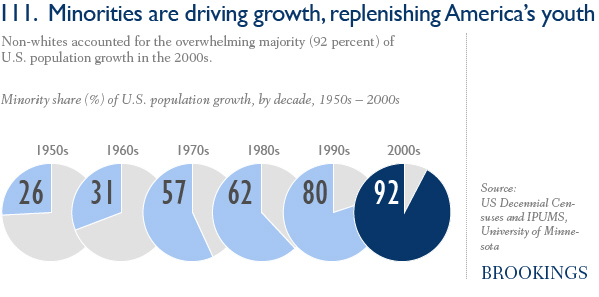
Non-whites, especially Hispanics and Asians, accounted for the overwhelming majority (92 percent) of U.S. population growth in the 2000s. In the nation’s 100 largest metro areas, whites now account for 57 percent of population, down from 71 percent in 1990. Immigration drove some of this increasing racial and ethnic diversity, with the foreign-born numbering 40 million nationwide by 2010, nearly 13 percent of U.S. population. The youngest Americans herald our coming transition to a “majority minority” nation; 50 percent of infants under age one are now non-white.
As racial/ethnic minority and immigrant populations continue to grow, they are also dispersing into new locations across and within metropolitan America. In 2010, minorities made up more than half the population in 22 large metro areas, up from 14 in 2000 and just five in 1990. African American population in particular is returning to the South, with three-quarters of the group’s U.S. gains occurring in that region in the 2000s. And for the first time, a majority of every major racial and ethnic group in large metro areas lives in the suburbs, as segregation—while still high—continues to decline.
What it means
Large metro areas, and increasingly their suburbs, stand at the forefront of America’s transformation into a multiethnic society. How they respond to and manage that shift, especially the social and economic opportunities they provide to a highly diverse population of families with children, will establish the course for our nation’s well-being over the coming decades. Rapid growth in the immigrant population in some parts of the country produced late-decade policy backlashes that could threaten these places’ longer-run economic well-being.
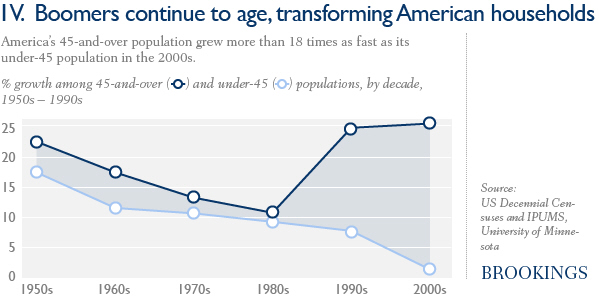
The oldest members of the baby boom generation, born between 1946 and 1964, entered seniorhood at the end of the 2000s as the youngest members crossed fully into middle age. As a result, America’s 45-and-over population grew more than 18 times as fast as its under-45 population in the 2000s, and more than half the nation’s voting-age population is at least 45 years old. Boomer aging, and delays in marriage and childbearing among younger groups, account for the fact that only 20 percent of U.S. households today are married couples with children under 18, down from twice that share in 1970.
While all parts of the country are aging, places are increasingly divided by growth or decline in their youth. Under-45 populations in 36 of the largest 100 metro areas, particularly places like Buffalo and Cleveland, declined in the 2000s even as they rose by at least 10 percent in 29 metro areas like Raleigh and Las Vegas. Boomer aging in place is also transforming suburbia, where 40 percent of residents are age 45 and older, compared with 35 percent in cities. Significant racial and ethnic differences by age further define these patterns in some parts of the country; less than 40 percent of Arizona’s children are white, compared with more than 80 percent of its seniors.
What it means
The older population is growing everywhere, and a host of public and private services will be adapted to an aging population in the decades to come. Areas that are also gaining younger populations may have a resource advantage in responding to those changes, compared to rapidly aging northern states and metro areas. Yet because the former areas have more racially and ethnically diverse young people, they too may face challenges in managing competition for scarce public resources between predominantly white seniors and minority families with children.
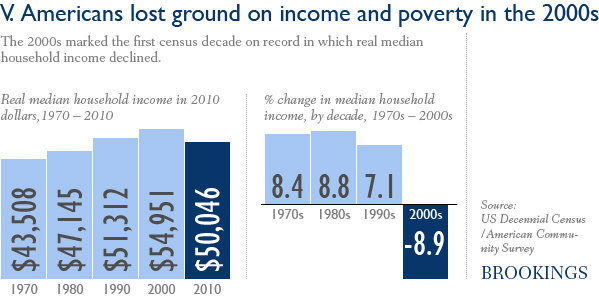
The 2000s marked the first census decade on record in which real median household income declined. The typical household earned $50,046 in 2010, down 8.9 percent from 2000. And the share of people living in poverty hit 15.3 percent, the highest level since 1993. The negative trends surely reflect the deep recession affecting the country in the late 2000s, but also the limited progress experienced by average households and the poor during the years in which the overall economy grew.
Economic pain was widespread across the nation. Nearly all (91) of the 100 largest metro areas ended the decade with lower median incomes than in 2000. Sun Belt areas on the front lines of the housing market collapse (Orlando, Las Vegas, Riverside), manufacturing metros (Indianapolis, Cleveland), and many parts of the Southeast (Birmingham, Nashville) ranked among the places experiencing large poverty increases during, and sometimes even before, the Great Recession. Suburbs shared much more in the rise of metropolitan poverty, with their poor residents growing 53 percent over the decade, a shift driven partly by the suburban growth of new immigrant populations.
What it means
Census 2000 captured American households at a high-water mark economically, a far different situation than they faced in 2010. Economic growth strategies for the coming decade must place greater emphasis on achieving shared prosperity that lifts incomes for a broad segment of households. With unemployment projected to remain high for some time, many parts of the country will confront higher fiscal and social burdens associated with poverty, including concentrated poverty, for the foreseeable future. All metro areas, meanwhile, must continue to adapt a traditionally city-focused social services infrastructure for helping the poor to the reality of region-wide needs.
