Income and well-being: cross-country comparisons
(Gallup World Poll, 2008 to 2012)
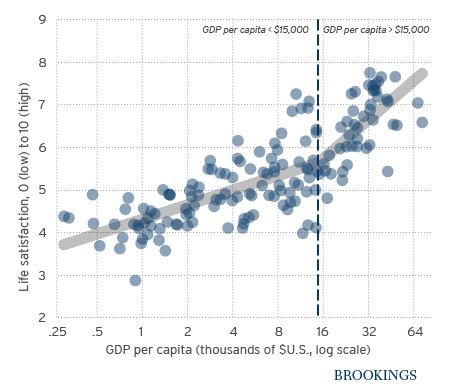
Each circle represents a country surveyed in the Gallup World Poll. The grey line approximates the satisfaction-income relationship, segmented for richer countries and poorer ones. The horizontal axis shows GDP per capita on a log scale, meaning that each tick represents a doubling of income.

If extra income no longer mattered for well-being once basic needs were met, we would expect the line to be flat, or to plateau for richer countries. Instead the slope of the line actually steepens for richer countries, indicating that the well-being–income relationship extends to them as well.
Income and well-being: within-country comparisons
(25 most populous countries; Gallup World Poll, Dec. 2007)
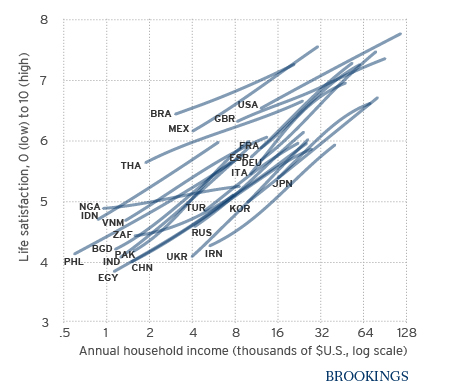
Gallup data also sheds light on income and well-being within nations. The lines below approximate the satisfaction-income relationship for the world’s 25 most populous countries. The horizontal axis shows household income on a log scale, meaning that each tick represents a doubling of income.

While there are some differences in the slopes, the more remarkable feature is simply that for every country, the relationship estimated at low incomes appears to hold in roughly equal measure at higher incomes. In particular, there is no evidence that the slope flattens out beyond any particular “satiation point” in any nation.