
Key statistics on inclusion at the most recent African Leaders Summits hosted by China, the European Union, Japan and the United States, including number of countries invited and number of preparatory events held before the summit.
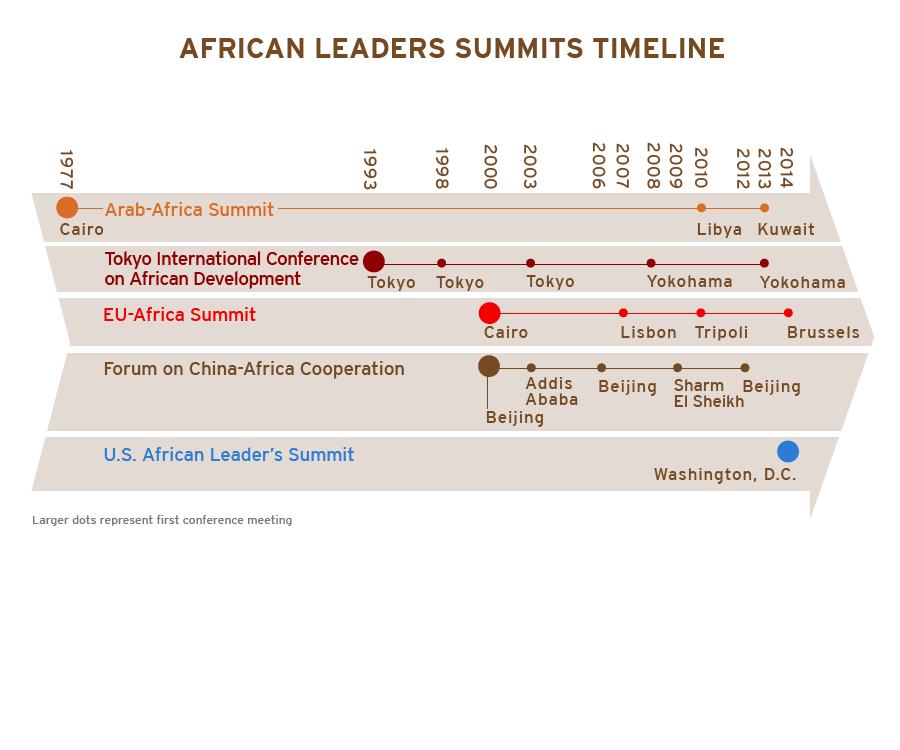
An African Leaders Summits timeline showing the inception and frequency of summits hosted by the Arab League, Japan, the European Union, China and the United States.

Volumes (in billions US$) and shares of U.S., Japanese, EU and Chinese FDI stock in sub-Saharan African countries in 2001 and 2012.
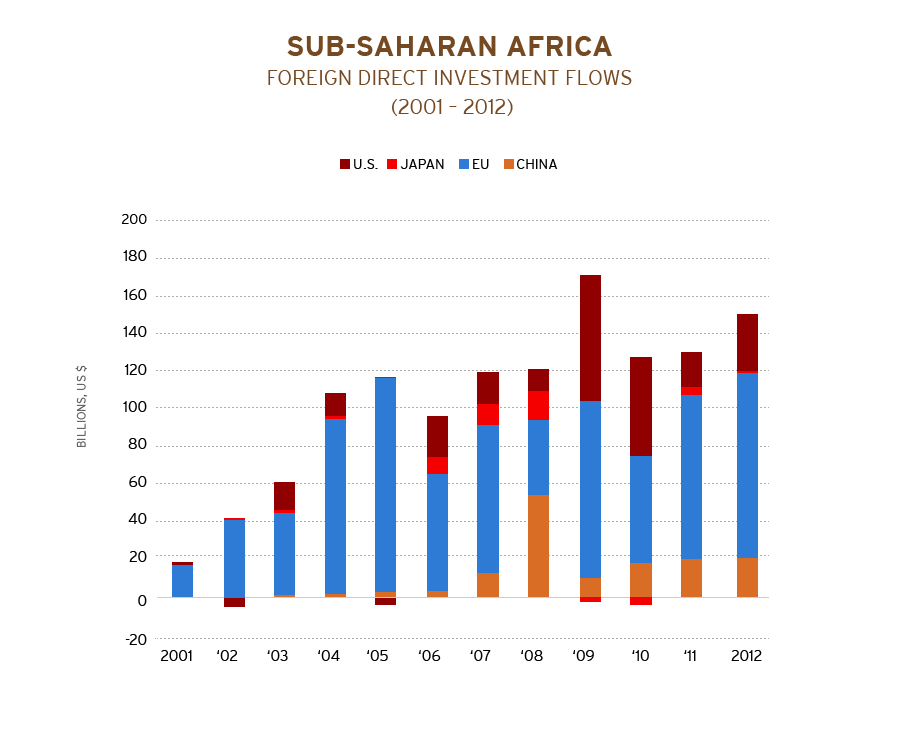
Volumes (in billions US$) and shares of U.S., Japanese, EU and Chinese FDI flows in sub-Saharan African countries from 2001 to 2012.
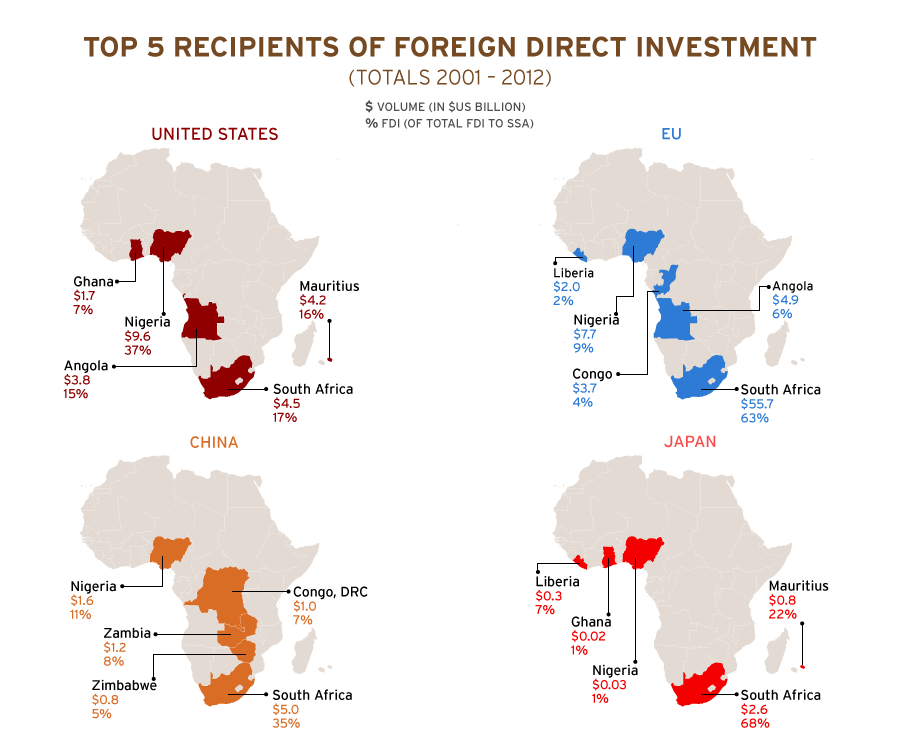
Top five destinations (within sub-Saharan Africa) of total FDI flows from 2001 to 2012 for the U.S., EU, China and Japan.
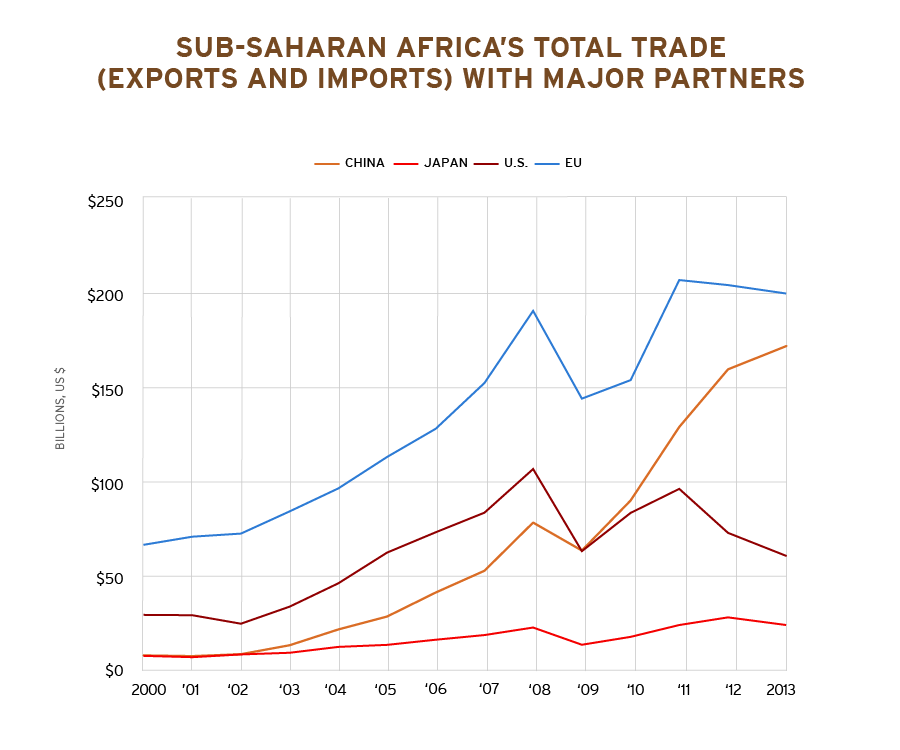
Total trade (exports + imports, in billions US$) between China, Japan, the EU and the United States and sub-Saharan African countries from 2000 to 2013.

Exports and imports (in billions US$) of the EU, the U.S., China and Japan to/from sub-Saharan African countries.

Share of world exports and imports of the EU, the U.S., China and Japan to/from sub-Saharan African countries.

Locations of U.S. trade and commercial offices (including U.S. Agency for International Development, Trade and Development Agency and Department of Commerce offices) and foreign commercial service officers in sub-Saharan Africa.
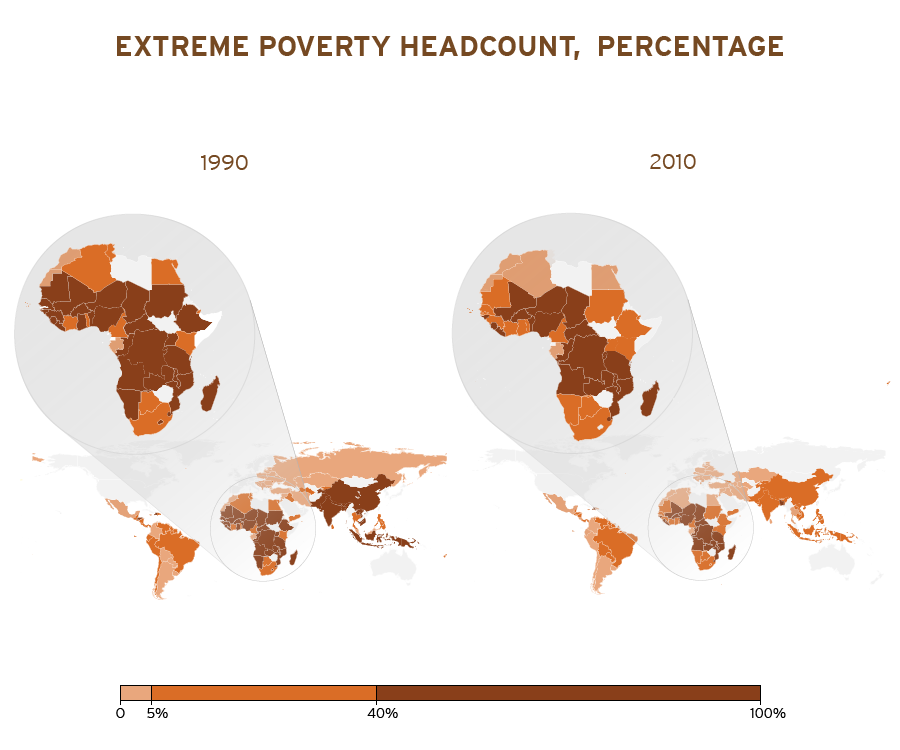
Percentage of the population affected by extreme poverty in 1990 and 2010.
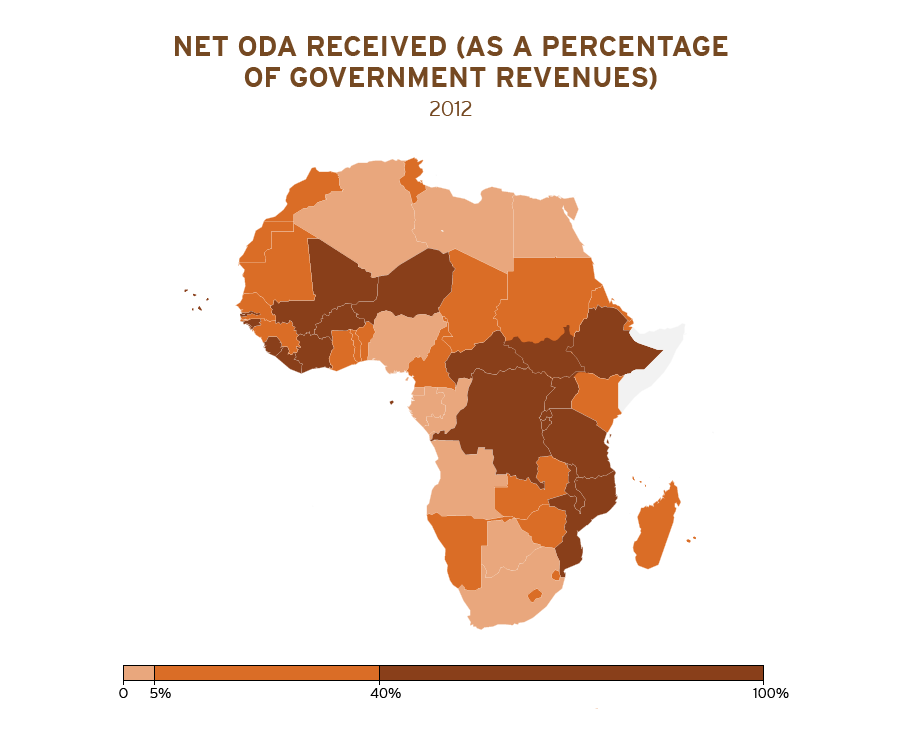
Net ODA received by African countries as a percentage of government revenues in 2012. The map shows 20 countries in Africa for which total foreign assistance is equivalent to more than 40 percent of the national budget.