1
Summary of Findings
An analysis of occupational employment data for the United States reveals that:
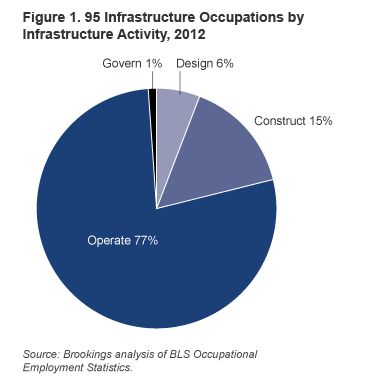
- In 2012, 14.2 million workers were employed in infrastructure jobs across the country, accounting for 11 percent of national employment. Truck drivers, electricians, and civil engineers are among the occupations employing the most workers overall, the broad majority of whom (77 percent) focus on operating infrastructure rather than its construction (15 percent), design (6 percent), or governance (2 percent). At the same time, 9.1 million of these jobs are found in the nation’s 100 largest metropolitan areas, with logistics hubs like Memphis and Louisville having the highest share of workers involved in infrastructure-related activities.
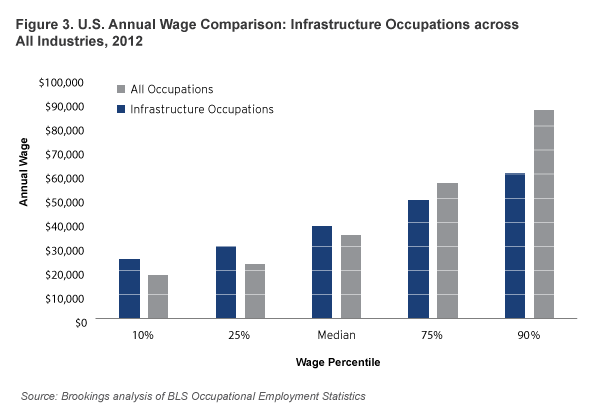
- Infrastructure occupations tend to offer more equitable wages compared to all occupations nationally, paying over 30 percent more to workers at lower ends of the income scale. Workers in infrastructure occupations earn significantly higher wages at the 10th and 25th percentile ($24,750 and $30,190) relative to all workers in the U.S. ($18,090 and $22,480). These not only include specialized occupations that pay above-average wages such as nuclear engineers and hydrologists, but also other sizable occupations such as telecommunication line installers and water treatment plant operators found in nearly every metropolitan area throughout the country.
- More than 80 percent of workers employed in infrastructure occupations typically have short- to long- term on-the-job training, but only 12 percent hold a bachelor’s degree or higher and generally need less education to qualify for these jobs. Many infrastructure jobs have low barriers of entry in terms of formal education, including cargo agents, rail car repairers, and other trade occupations, which frequently rely on skills developed on the job. However, these workers still earn competitive wages across a variety of occupations, ranging from gas compressor operators to septic tank servicers.
- Infrastructure occupations are projected to increase 9.1 percent during the next decade, including the need to replace more than 2.7 million workers. From 2012 to 2022, many infrastructure jobs are projected to grow by thousands of additional workers, led by fast-growing occupations such as wind turbine service technicians and solar photovoltaic installers. Critically, though, there will be a need to replace almost one quarter of this infrastructure workforce due to retirements and other employment shifts.
This report sheds new light on the widespread contributions that infrastructure jobs make to the nation’s economy, including their importance at the metropolitan level. Since many of these jobs offer more equitable wages, require less formal education for entry, and are projected to grow over the next decade, they represent a key area of consideration for policymakers aiming to address the country’s ongoing infrastructure and jobs deficit.
2
Data for the 100 Largest Metro Areas
Brookings is a non-profit institution and the charts above were created using Highsoft software under a non-commercial license, the terms of which can be found here. Please note that Highsoft software is not free for commercial use.
3
Introduction
For decades, policymakers have called for more spending on America’s infrastructure to stimulate job growth. In 1982, President Ronald Reagan wanted to raise the federal gasoline tax by a nickel to generate “real, worthwhile work.“1 President George H. W. Bush was widely quoted in 1991 after signing a federal transportation law that, he said, “could be summed up in three words: jobs, jobs, jobs.”2 Similarly, the American Recovery and Reinvestment Act of 2009 focused on job preservation by pumping billions of dollars into “shovel-ready” transportation, energy, and water projects.3 In his latest State of the Union address, President Barack Obama noted how “first- class jobs gravitate to first-class infrastructure” through new ladders of opportunity into the middle class.4
In many ways, this focus is understandable in Washington and beyond given the recent economic struggles facing the country. Construction jobs, after all, accounted for one-third of the jobs lost since the start of the Great Recession, and they are still 1.5 million below their pre-recession level despite three years of steady increases.5 Spending on infrastructure also attracts attention from policymakers owing to the large multiplier effects these projects can often have on the overall economy, which can lead to gains in productivity and employment.6
Yet, as policymakers continue to direct attention to infrastructure, they do not always identify the exact types of jobs supported by these investments. By limiting infrastructure employment to construction alone, and viewing it largely in terms of stimulus spending, policymakers have not considered the breadth of infrastructure jobs found across the U.S. economy.
For example, investing in systems essential to providing clean water, efficient energy, and safe transportation are key priorities in preparation for extreme weather events, but the particular jobs responsible for managing these systems are often left undefined.7 Such ambiguity makes it difficult to develop targeted solutions in a time of political gridlock and constrained budgets. Beyond investing in physical structures, then, policymakers need to ask whether the nation has the workforce necessary to tackle these pressing challenges.
This report aims to define a more precise range of jobs in occupations and industries that play a distinct role in the design, construction, operation, and governance of the nation’s infrastructure assets. It explores where this employment is concentrated nationally and provides insight into the wages, projections, and skills required for these jobs. Through this comprehensive approach, the report finds that infrastructure employment spans across a variety of public and private sectors—from pipelines and railroads to warehouses and utilities—containing an array of jobs that pay competitive wages, have low barriers of entry, and are expected to grow in years to come.
4
Background and Approach
Attempts to measure infrastructure employment are complicated by the ever-expanding and evolving definition of infrastructure itself. Depending on the individual or organization involved in a given project infrastructure can take on many different meanings and lead to an uneven assessment of its true extent, economically or otherwise.8 On the one hand, infrastructure serves as an essential foundation for public services such as water, electricity, and waste removal, which allow communities to function on a daily basis.9 It also represents an important form of physical capital for investors interested in managing risk, facilitating commerce, and building wealth.10 Still, to others, infrastructure includes social institutions such as schools, hospitals, and prisons that are vital to the nation’s education, health, and security.
At the same time, determining which jobs fall under each of these categories can lead to a confounding number of possibilities. Unlike workers in construction, manufacturing, or even STEM-related fields (science, technology, engineering, and math), little precedent exists for identifying the knowledge required and activities carried out by infrastructure workers.11 Since infrastructure spans numerous types of establishments, these workers vary considerably in the products they handle and services they provide as well. Infrastructure jobs share many of the same complexities of those jobs in the “clean” economy—the sector that produces goods and services with an environmental benefit—which lack standard guidelines, definitions, and data to isolate their employment.12
Our initial goal in this analysis is to develop a consistent definition for infrastructure, building on previous reports to help capture a clear range of employment opportunities. Among prior studies, Statistics Canada (StatCan) offers a detailed approach to measure infrastructure’s economic scope at a national level. By classifying these assets into industry sectors on the basis of their physical functions and characteristics, StatCan was able to compare infrastructure investments over time.13 Rather than relying on an ad hoc definition as many reports do, we follow StatCan’s lead and focus on a set of tangible assets that support the nation’s larger infrastructure network.
In turn, we establish the following definition of infrastructure:
In general, infrastructure encompasses a broad range of systems and facilities designed, constructed, operated, and governed across the public and private sector. Foundational in nature, these physical assets are either manmade or natural, often operate as part of larger networks, support a variety of economic activities, and provide a host of other services with a clear public benefit over the course of many years.
As a first step, we use the seven infrastructure sectors described below. Each sector’s distinct specialty—from transportation to water and energy—helps isolate the services provided within this expansive space. Although the separation between these sectors is not absolute, each typically depends on different frameworks to get projects done, contains assets overseen by unique groups of public and private actors, and supports infrastructure in a highly individualized manner.14 In this way, the sectors offer a useful guide to home in on specific jobs of interest.
Seven Infrastructure Sectors
-

Intra-Metro Transportation includes local roads and bridges; public transit such as subways and buses; taxis and limousines; sightseeing transportation; and bicycle/pedestrian infrastructure.
-

Inter-Metro Transportation includes passenger rail, airports, and highways, and inter-urban and rural bus transportation.
-

Trade and Logistics includes freight rail, air cargo operations, trucking, seaports/inland waterways, transportation support, and warehousing and express/local delivery services.
-

Energy includes the generation, transmission, and distribution of energy from natural gas (pipelines), facilities responsible for electricity (nuclear, hydroelectric, and solar/wind), and other utilities.
-

Water includes clean/drinking water, stormwater, wastewater, sewage/water treatment facilities, and “green” infrastructure critical to conserving related natural resources.
-

Telecommunications include broadband and transmission infrastructure (wired, wireless, and satellite), concentrated in facilities outside radio and television broadcasting.
-

Public Works include streetscapes, land redevelopment, and waste/landfills (solid waste, hazardous materials, and remediation).15
Based on our definition, we consequently classified infrastructure jobs in terms of occupations and industries engaged in these activities, regardless of the ownership or output associated with individual establishments.16 Although this approach follows the green jobs methodology used by the U.S. Bureau of Labor Statistics (BLS) to some degree, our analysis focuses more on the services provided by workers in relevant activities rather than the type of products created. Workers who help forge metals, extract raw energy resources, or assemble vehicles, for instance, are among those employed in jobs that fall outside the scope of this definition.
As a result, workers may frequently carry out different responsibilities depending on their specific line of work, but they directly support the long-term performance of the nation’s infrastructure across several clearly delineated sectors.17 For example, although some engineers specialize in the design of bridges, dams, and large-scale utility projects, other technicians concentrate on the operation of these facilities. Meanwhile, pipe layers and electricians physically install needed components, and certain managers, analysts, and planners contribute to oversight and governance.
Key Terms
Infrastructure Jobs
Employment opportunities based on the total number of workers in occupations and industries in the seven infrastructure sectors.
Occupations
The activities that employees regularly carry out for pay, which are grouped into distinct categories on the basis of similar job duties as outlined in the 2010 Standard Occupation Classification (SOC) system.18 In total, there are more than 800 detailed occupations found across all industries. “Infrastructure occupations,” in particular, are often concentrated in infrastructure activities and perform duties central to infrastructure design, construction, operation, and governance.
Industries
Groups of establishments that provide similar goods or services, as determined by the 2012 North American Industry Classification System (NAICS). Private and government-owned establishments are included, while agricultural establishments and private households are excluded. “Infrastructure industries,” in particular, provide services closely linked to at least one of the seven infrastructure sectors.
Employment
The total number of full-time and part-time workers paid a wage or salary, excluding household and self-employed workers, as defined in the Bureau of Labor Statistics (BLS) Occupational Employment Statistics (OES) survey.19
Wages
Based on straight-time, gross pay over a standard work period, as defined in the OES survey. These include tips, production bonuses, cost-of-living allowances, and over-the-road pay based on mileage. However, overtime pay, back pay, and holiday bonuses are among the types of compensation excluded.20 Wages include mean hourly and annual pay, but also percentile wages (10th, 25th, 50th, 75th, and 90th). The latter are based on the percentage of workers who earn wages below a certain value. For instance, if $9.00 represents the 10th percentile wage for a given occupation, this means that 10 percent of workers employed in the occupation earn less than this amount.
Skills
Levels of education and training typically needed to perform the duties in a particular line of work. Similar to BLS, we use three categories to classify skills across different occupations: education required for entry, related work experience, and on-the-job training to demonstrate competency.21
Through this approach, we identify 95 occupations whose employment is often linked to specific infrastructure assets and other relevant work activities.22 This report examines a variety of occupations, including telecommunication line installers, power plant operators, and aircraft mechanics, many of whom perform specialized tasks and use specialized knowledge and tools to support infrastructure assets.23 Some occupations, such as railroad conductors and cargo agents, have especially high concentrations of employment dealing with particular types of infrastructure. In other words, infrastructure jobs are found in an assortment of occupations that are essential to the long-term operation of various infrastructure assets. Public-sector workers at the federal, state, and local levels play a large role as well.24
Although several additional occupations could conceivably be considered—including those involved in the postal service—the 95 occupations represent a discrete collection of jobs that design, construct, operate, and govern the nation’s infrastructure in a well-defined capacity. Their employment, as such, is counted across all industries at the national and metropolitan level.
To complement these 95 occupations, the analysis also includes workers employed in 42 industries closely aligned with the seven infrastructure sectors. In addition to energy and transportation, many industries have a clear focus in trade and logistics, as evident in the enormous employment totals for freight trucking, warehousing, and delivery services. However, the notable lack of workers counted in several interrelated sectors, such as water, illustrates how these industries do not necessarily capture a full range of infrastructure employment on their own, pointing to the importance of the occupations defined above.25
For more information on the report’s methodology, see Appendix B in the PDF download.
5
Findings
A. In 2012, 14.2 million workers were employed in infrastructure jobs across the country, accounting for 11 percent of national employment.
Nationally, infrastructure jobs touch every corner of the economy, supporting the movement of people and goods, the distribution of energy and water, and the deployment of technologies and related services.
Of the 14.2 million workers involved in these infrastructure activities—making up 11 percent of the nation’s total employment—11.4 million are employed in the 95 infrastructure occupations and 2.8 million are employed in the 42 infrastructure industries.26 Occupations with the most workers include material movers, truck drivers, and electricians, accounting for nearly 30 percent of all infrastructure jobs, while nuclear engineers, hydrologists, and logisticians are among the smaller, more specialized infrastructure occupations. Combined, the 20 largest occupations make up nearly two-thirds (63 percent) of all infrastructure employment throughout the nation.
The 2.8 million workers in the 42 infrastructure industries are led by freight trucking, warehousing, and wired telecommunications carriers. For the most part, these workers carry out generalized tasks in support of larger infrastructure operations by fulfilling essential administrative duties, managing daily finances, and providing a range of other services in different establishments. As a result, they can vary widely in their occupational focus, despite their significant concentration in infrastructure industries. Office clerks, accountants, customer service representatives, operating engineers, and construction laborers rank among the largest occupations in this respect.
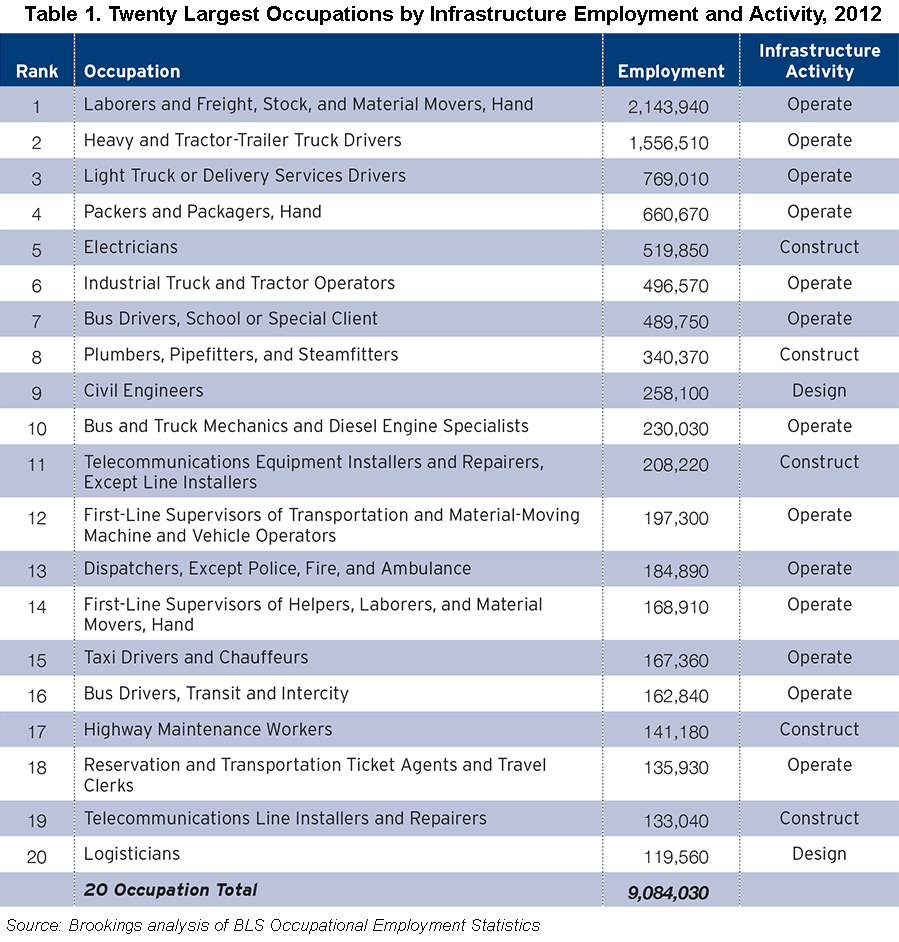
Contrary to popular belief, most workers employed in infrastructure jobs tend to operate physical assets, rather than constructing or installing them.27 Across all infrastructure occupations, 77 percent of workers are primarily concerned with operation versus 15 percent with construction, 6 percent with design, and fewer than than 2 percent with governance. This focus is also apparent among workers in the 20 largest infrastructure occupations in Table 1, where 7.4 million work in operations (81 percent) compared to only 1.3 million in construction (15 percent). These shares help to not only clarify the type of duties in infrastructure occupations, but also underscore the variety of tasks—and skills needed—to maintain infrastructure assets in the long term.
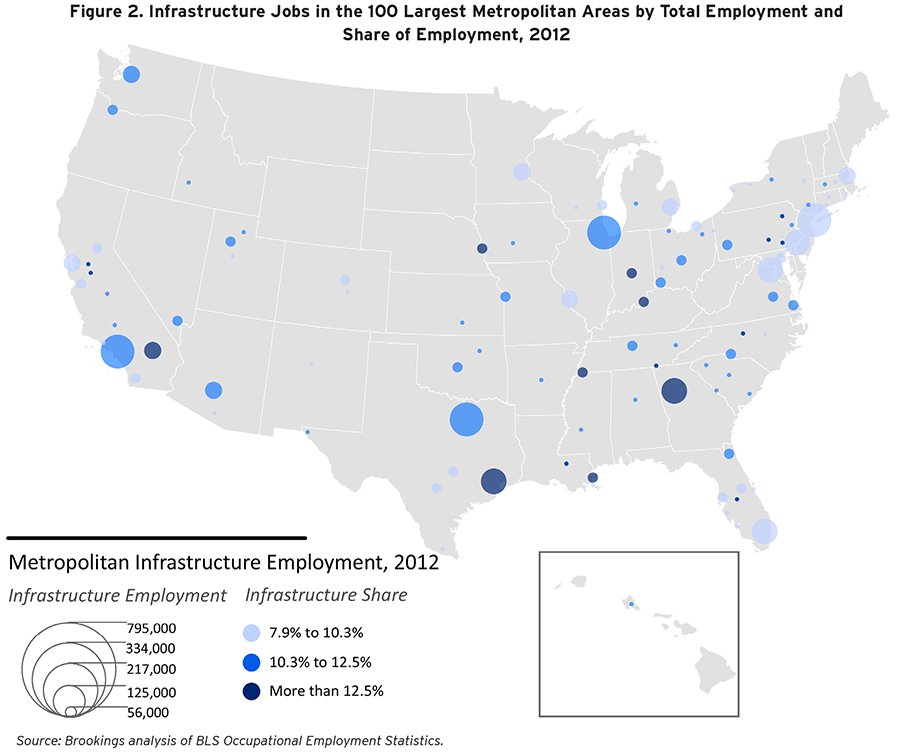
Infrastructure workers also play a key role in driving metropolitan economic growth. Combined, 9.1 million workers are employed in infrastructure jobs in the 100 largest metropolitan areas, and they make up 64 percent of U.S. infrastructure employment, on par with their 66 percent share of the country’s population.28 Trade and logistics jobs are particularly widespread and represent four of the five largest infrastructure occupations; material movers, heavy truck drivers, light truck drivers, and packers and packagers alone account for 36 percent of all metropolitan infrastructure employment.
Not surprisingly, the largest labor markets have the most infrastructure employment overall. For example, New York, Los Angeles, and Chicago are the nation’s three largest labor markets and alone contain more than 1.8 million infrastructure workers. This total exceeds the number of infrastructure workers employed in the smallest 55 metropolitan areas combined. Poughkeepsie, Palm Bay, and Colorado Springs, for example, are among the nation’s smallest markets and have fewer than 60,000 workers employed in infrastructure jobs.
As a share of total employment, however, infrastructure jobs stand out in several metropolitan areas and reveal distinct patterns in labor specialization. In total, 46 metropolitan areas have shares of infrastructure employment above the national average (11 percent). These include warehousing and logistics hubs such as Memphis (17.8 percent) and Louisville (13.6 percent) as well as energy and utility centers such as New Orleans (12.8 percent) and Houston (12.5 percent).29 Seattle has the most avionics technicians, Richmond has the most nuclear engineers, and Chicago has the most septic tank servicers. In contrast metropolitan areas that are not major logistics hubs but have other economic specialties have lower shares of infrastructure employment, such as Washington, D.C. (8.4 percent), Austin, TX (8.8 percent), and Tucson, AZ (8.9 percent).
Beyond Infrastructure: Examining Out-of-Scope Occupations and Industries
Infrastructure jobs cut across a number of occupations and industries, but millions of closely related jobs appear in several additional areas of the economy. Although these jobs involve similar skills and responsibilities, they do not connect as directly to the infrastructure sectors outlined in this report. Instead, they are frequently found in residential and other building construction, mining and energy extraction, and the postal service. In many cases, workers in these jobs focus on projects over a shorter timeframe and carry out a wider range of tasks that fall outside the scope of infrastructure design, construction, operation, and governance.
For example, residential and other building construction employs more than 4 million workers, who concentrate on the installation of windows, flooring, and site-specific improvements.30 Roofers and brick masons, in turn, are among the many trade occupations in these industries and have duties that differ markedly depending on the contractor involved, unlike workers employed in heavy and civil engineering construction.31 On the other hand, electricians and pipelayers in residential and other building projects help maintain the energy and water systems crucial to long-term infrastructure performance, so they are included in this report.32
In the same way, only certain jobs in mining and extraction are counted, rather than the industry as a whole.33 The generation, transmission, and distribution of energy rely on numerous infrastructure assets, ranging from hydroelectric plants and wind turbines to power lines and pipes. These jobs require more than 1 million workers.34 The mining sector alone, however, employs nearly 800,000 workers and focuses on extracting the raw materials needed to fuel this network. Similar to manufacturing, jobs in mining are primarily concerned with achieving higher levels of physical output, using inputs to drive productivity in oilfields, natural gas platforms, and refineries.35 Although certain pump operators are critical in the larger infrastructure network, several occupations such as derrick operators and roustabouts are limited to extraction activities and are not included in this report.
Despite its enormous role linking national communications and commerce, the U.S. Postal Service has jobs that do not always clearly relate to trade and logistics infrastructure.36 Employing more than 600,000 workers, the Postal Service depends on an extensive assortment of mail processing facilities, distribution centers, and retail outlets, each of which requires different types of labor and has different efficiency concerns.37 Although these individual establishments can have operations that closely parallel those in express delivery services and local messengers, both of which are included in this report, it is harder to distinguish the types of services postal workers offer in some cases. Clerks, mail carriers, and machine operators, for instance, may be responsible for a variety of tasks during the delivery process, as opposed to the truck drivers and cargo agents in warehousing and other well-defined freight activities.
B. Infrastructure occupations tend to offer more equitable wages than all occupations nationally, paying over 30 percent more to workers at lower ends of the income scale.
Infrastructure wages can vary widely depending on the specific occupation. As shown in Figure 3, though, infrastructure jobs tend to pay higher wages to workers at the 10th and 25th percentile ($24,750 and $30,190 annually) compared with all occupations nationally ($18,090 and $22,480), signaling their importance to workers at lower ends of the income spectrum. More than 7 million workers—across 86 different infrastructure occupations—earn more at these percentiles, including truck drivers, civil engineers, and water treatment plant operators.38 Infrastructure occupations also frequently pay higher median wages ($38,480) than the national median ($34,750); traffic technicians and sailors are among the infrastructure occupations earning median wages around $38,000.
While many infrastructure occupations pay lower wages to workers at the 75th and 90th percentile, their wages are more evenly distributed relative to all occupations in the United States. This lower wage dispersion, in turn, may indicate the potential for less wage growth in the long run, but may also lead to greater certainty for workers employed in these jobs, which benefit from structured wage practices as a result of unionization or other industry norms.39 For example, the ratio of wages earned by workers at the 90th and 10th percentile is significantly less for infrastructure jobs (2.5) than all others nationally (4.8) (see Figure 4). From ship captains (4.0) and nuclear technicians (2.3) to subway and streetcar operators (1.9), this 90/10 ratio is lower for workers in every infrastructure occupation compared with the nation a